Attention to precision fertilization: leaf stem research in potatoes (part 2)
Last week we focused on mineralization under varying weather conditions and on the soil’s nutrient retention capacity and fluctuating nitrogen levels in the soil. This week we will discuss the possibilities of measurement methods.

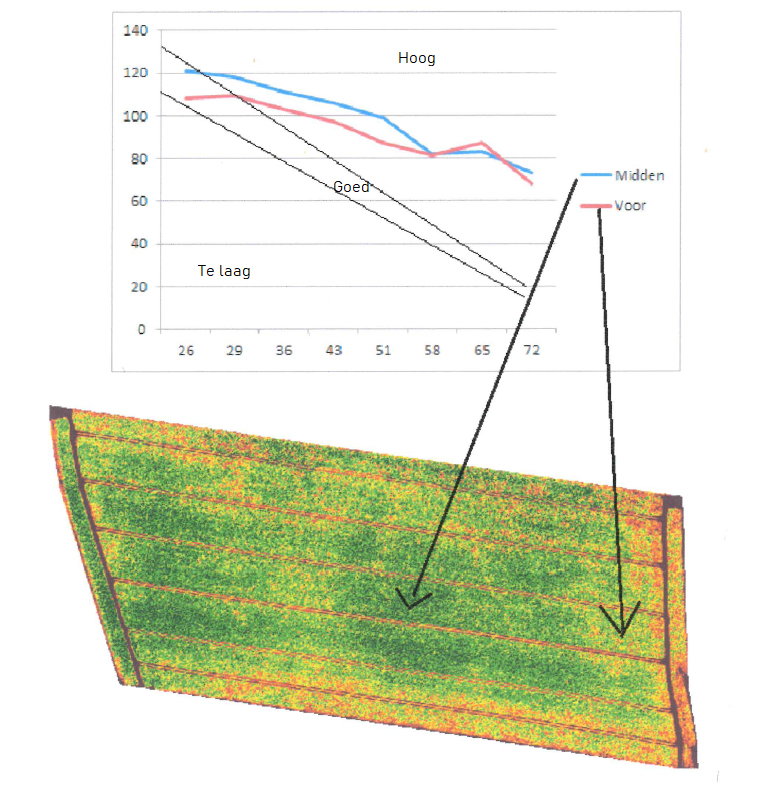
In this graph, two systems of measurement are compared. The soil scan with the colored fields indicates differences. There was a dark green part and a yellow part to be recognized. Petioles were collected from the dark green part, with the most biomass, and also from the yellow part. The blue line of the petiole test is from the petioles that were picked in the green part and the red line from the yellow part.
The graph above compares two systems of measurement. A potato plot was monitored during the entire growing season with the leaf stem examination and a soil scan was made at the start of the season. The soil scan with the colored fields indicates differences in the biomass. In the petiole chart, nitrate levels are interpreted as high, too low, or good. Which is then converted into a fertilization advice.

At the arable farm VOF Ipenburg of the family de Geus in Mookhoek (Hoeksche Waard), the development in nitrogen availability will be monitored in the coming months with the leaf stem method. Joke is a soil and fertilization expert and works for the Groen Agro Control laboratory in Delfgauw. She follows and describes the developments on the Innovators plot for TopBodem.
Measuring is not always knowing
The beauty of this picture is that the scan makes differences in the plot visible. Leaf stems were sampled and analyzed on these different fields throughout the growing period. The biomass of the potatoes that you measured with the scan has been observed, but may be difficult to interpret. That would be like putting a sick person on the scale instead of measuring his fever. However, with the leaf stem examination we could see that both the green part and the light part were sufficiently fertilized. And both parts of the lot had no shortages.
Innovator, first measurement
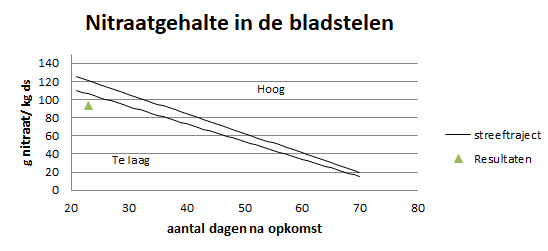
Now to the plot that we are following this year: The first measurement is shown as a green triangle in the small graph. In March, 34 cubic meters of CZAV mixed fertilizer was applied to this plot. This took place in beautiful dry conditions. This resulted in a grant of 114 kg N/ha. Together with the basic rate of 63 kg N, this comes to 177 kg N/ha. A petiole sample was taken on Monday 13 June. That is 23 days after emergence. The advice is: additional fertilization is necessary, + 75 kg N/ha.
In the coming months, arable farmers Joke and Leen de Geus will monitor the development in nitrogen availability using the leaf stem method. Joke is a soil and fertilization expert and works for the Groen Agro Control laboratory in Delfgauw. She follows and describes the developments on the Innovators plot for TopBodem.
Publication date: Jun 18, 2022
Author: Joke de Geus
Image: Joke de Geus
© Akkerwijze.nl/topbodem


